Dashboards
Advertisement
AnyChart JS Charts and Dashboards v.8.7.0
AnyChart is a flexible, cross-platform/browser, dependency-free JS chart library for adding interactive bar, area, pie, column, spline, scatter, line, gauge, treemap, funnel, sparkline, Mekko, Venn, other HTML5 charts/dashboards to any website/app.
Advertisement
MicroCharts
MicroCharts delivers an intuitive Excel add-in allowing you to create richer, more concise reports and dashboards with more information per square inch. Using the latest techniques in dashboard reporting, MicroCharts helps you generate data-rich tables
E-SoftEasy Business Analytics
Create HTML/PDF Reports/Charts/Dashboards from multiple Database Servers even from MS Excel. Filter, sort and group your data in any way ,create queries using your SQL knowledge, create master reports, design powerful ad hoc reports, show easily all your
BonaVista Dimensions v.1.0
Take your Excel reporting to new dimensions. With BonaVista Dimensions, you can produce higher-quality reports and dashboards in less time than you ever thought imaginable!
Access Dashboard v.3.4
homepage - Get latest Benefits Dashboards and reports for Microsoft Access Database.
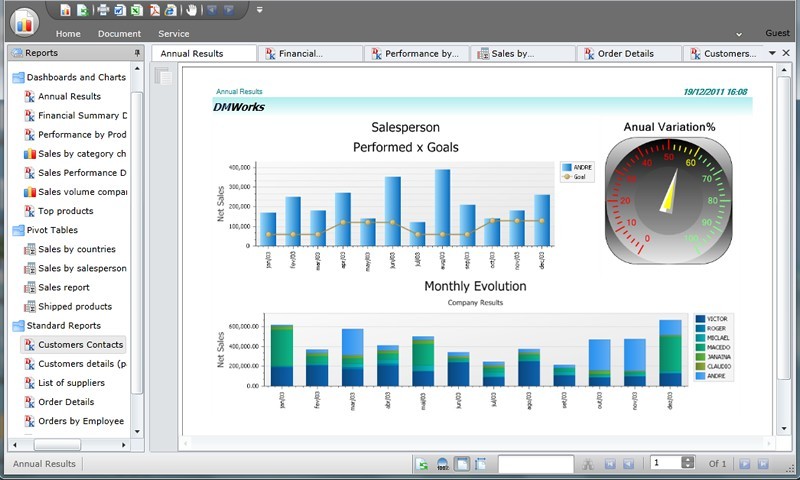
DMReports v.2.4.1
DMReports is a robust Business Intelligence platform which provides all necessary capabilities to build operational and analytical reports, interactive pivot tables, and visually compelling dashboards from your data and deliver reports both internall
Visual Requirements (VR)
VR is a practical, low-cost/low-risk solution to effectively develop and manage requirements. It enables effective definition of software, computer screens, interfaces, system components, processes, dashboards, information sources, etc. using an efficient

Flex/Flash components, RIA - FlexMonster
Flexmonster is one of the leading team that provided custom Flex applications development services and specializing in Rich UI extranets, dashboards and music/video streaming solutions. Developing Flex/Flash components (like Pivot table, LiveArt) and
Longitude v.10.0
New Heroix Longitude features improve monitoring, problem resolution. New group features, improved flexibility and control, customized report schedules and improved dashboards provide resource visibility at both enterprise and resource levels.
Excel Dashboard
Get latest download at http://www.exceldashboard.org Excel Dashboard Designer is a very versatile tool for building Dashboards and reports for Microsoft Excel. # No coding or SQL knowledge needed to build Dashboards # Build Superior

DbFace v.2.1.1
DbFace is an online app and chart report builder for SQL databases, with the straightforward interface allows you to create charts, reports, dashboards, form supported database applications in just a few clicks.